Ask Your Data
Anything.

Connect your warehouse, files, and databases. Ask in plain language. The agent writes real code, runs it, and returns charts and findings you can act on.

Get Portable Graphs and Visualizations

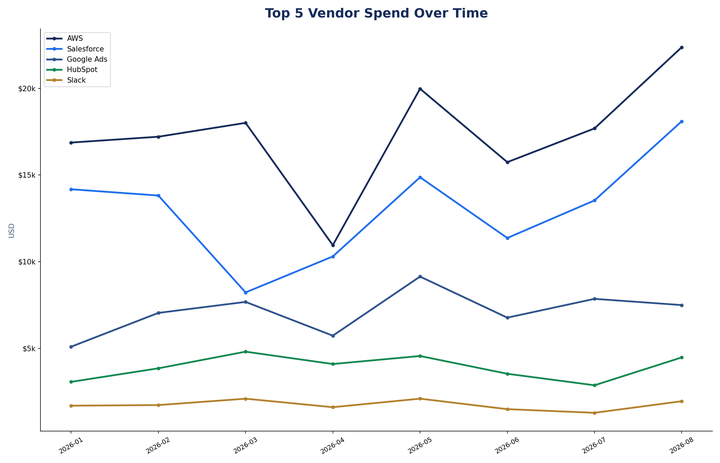
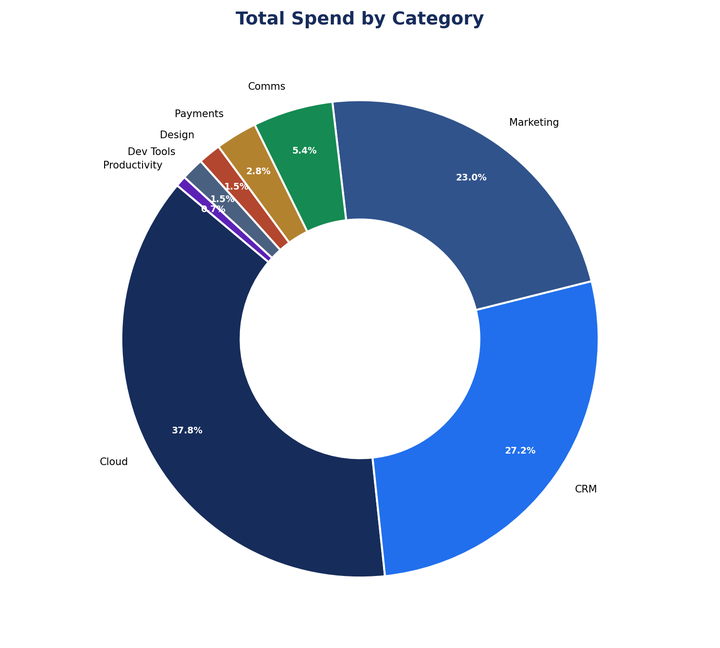
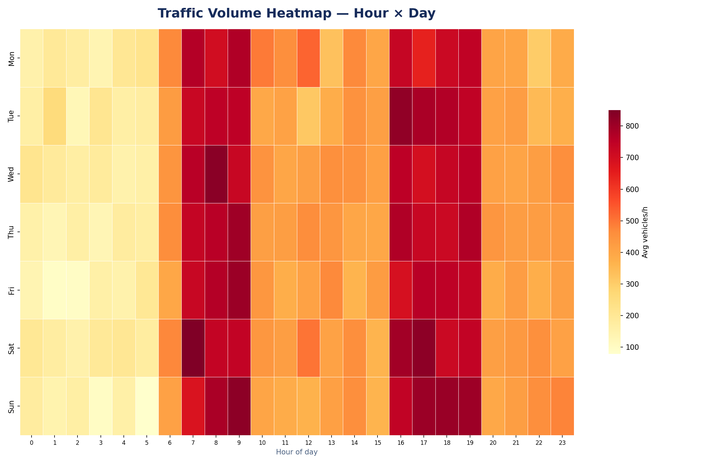
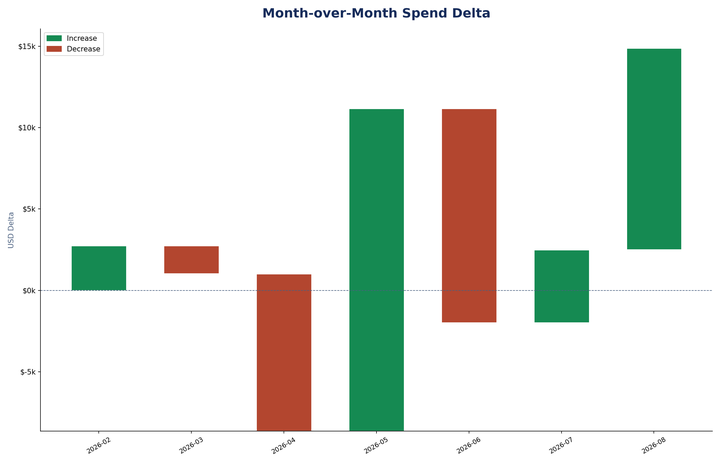
The output is something you can put in front of people: a rendered chart, the table behind it, and a written read of what actually changed.

Charts that render. Styled visualisations built from the result set — ready to drop into a deck or a doc.

The finding, written out. What moved, by how much, and what looks worth a second look.

Share it where you work. Export to a doc, post to Slack, or schedule it to re-run and send itself.
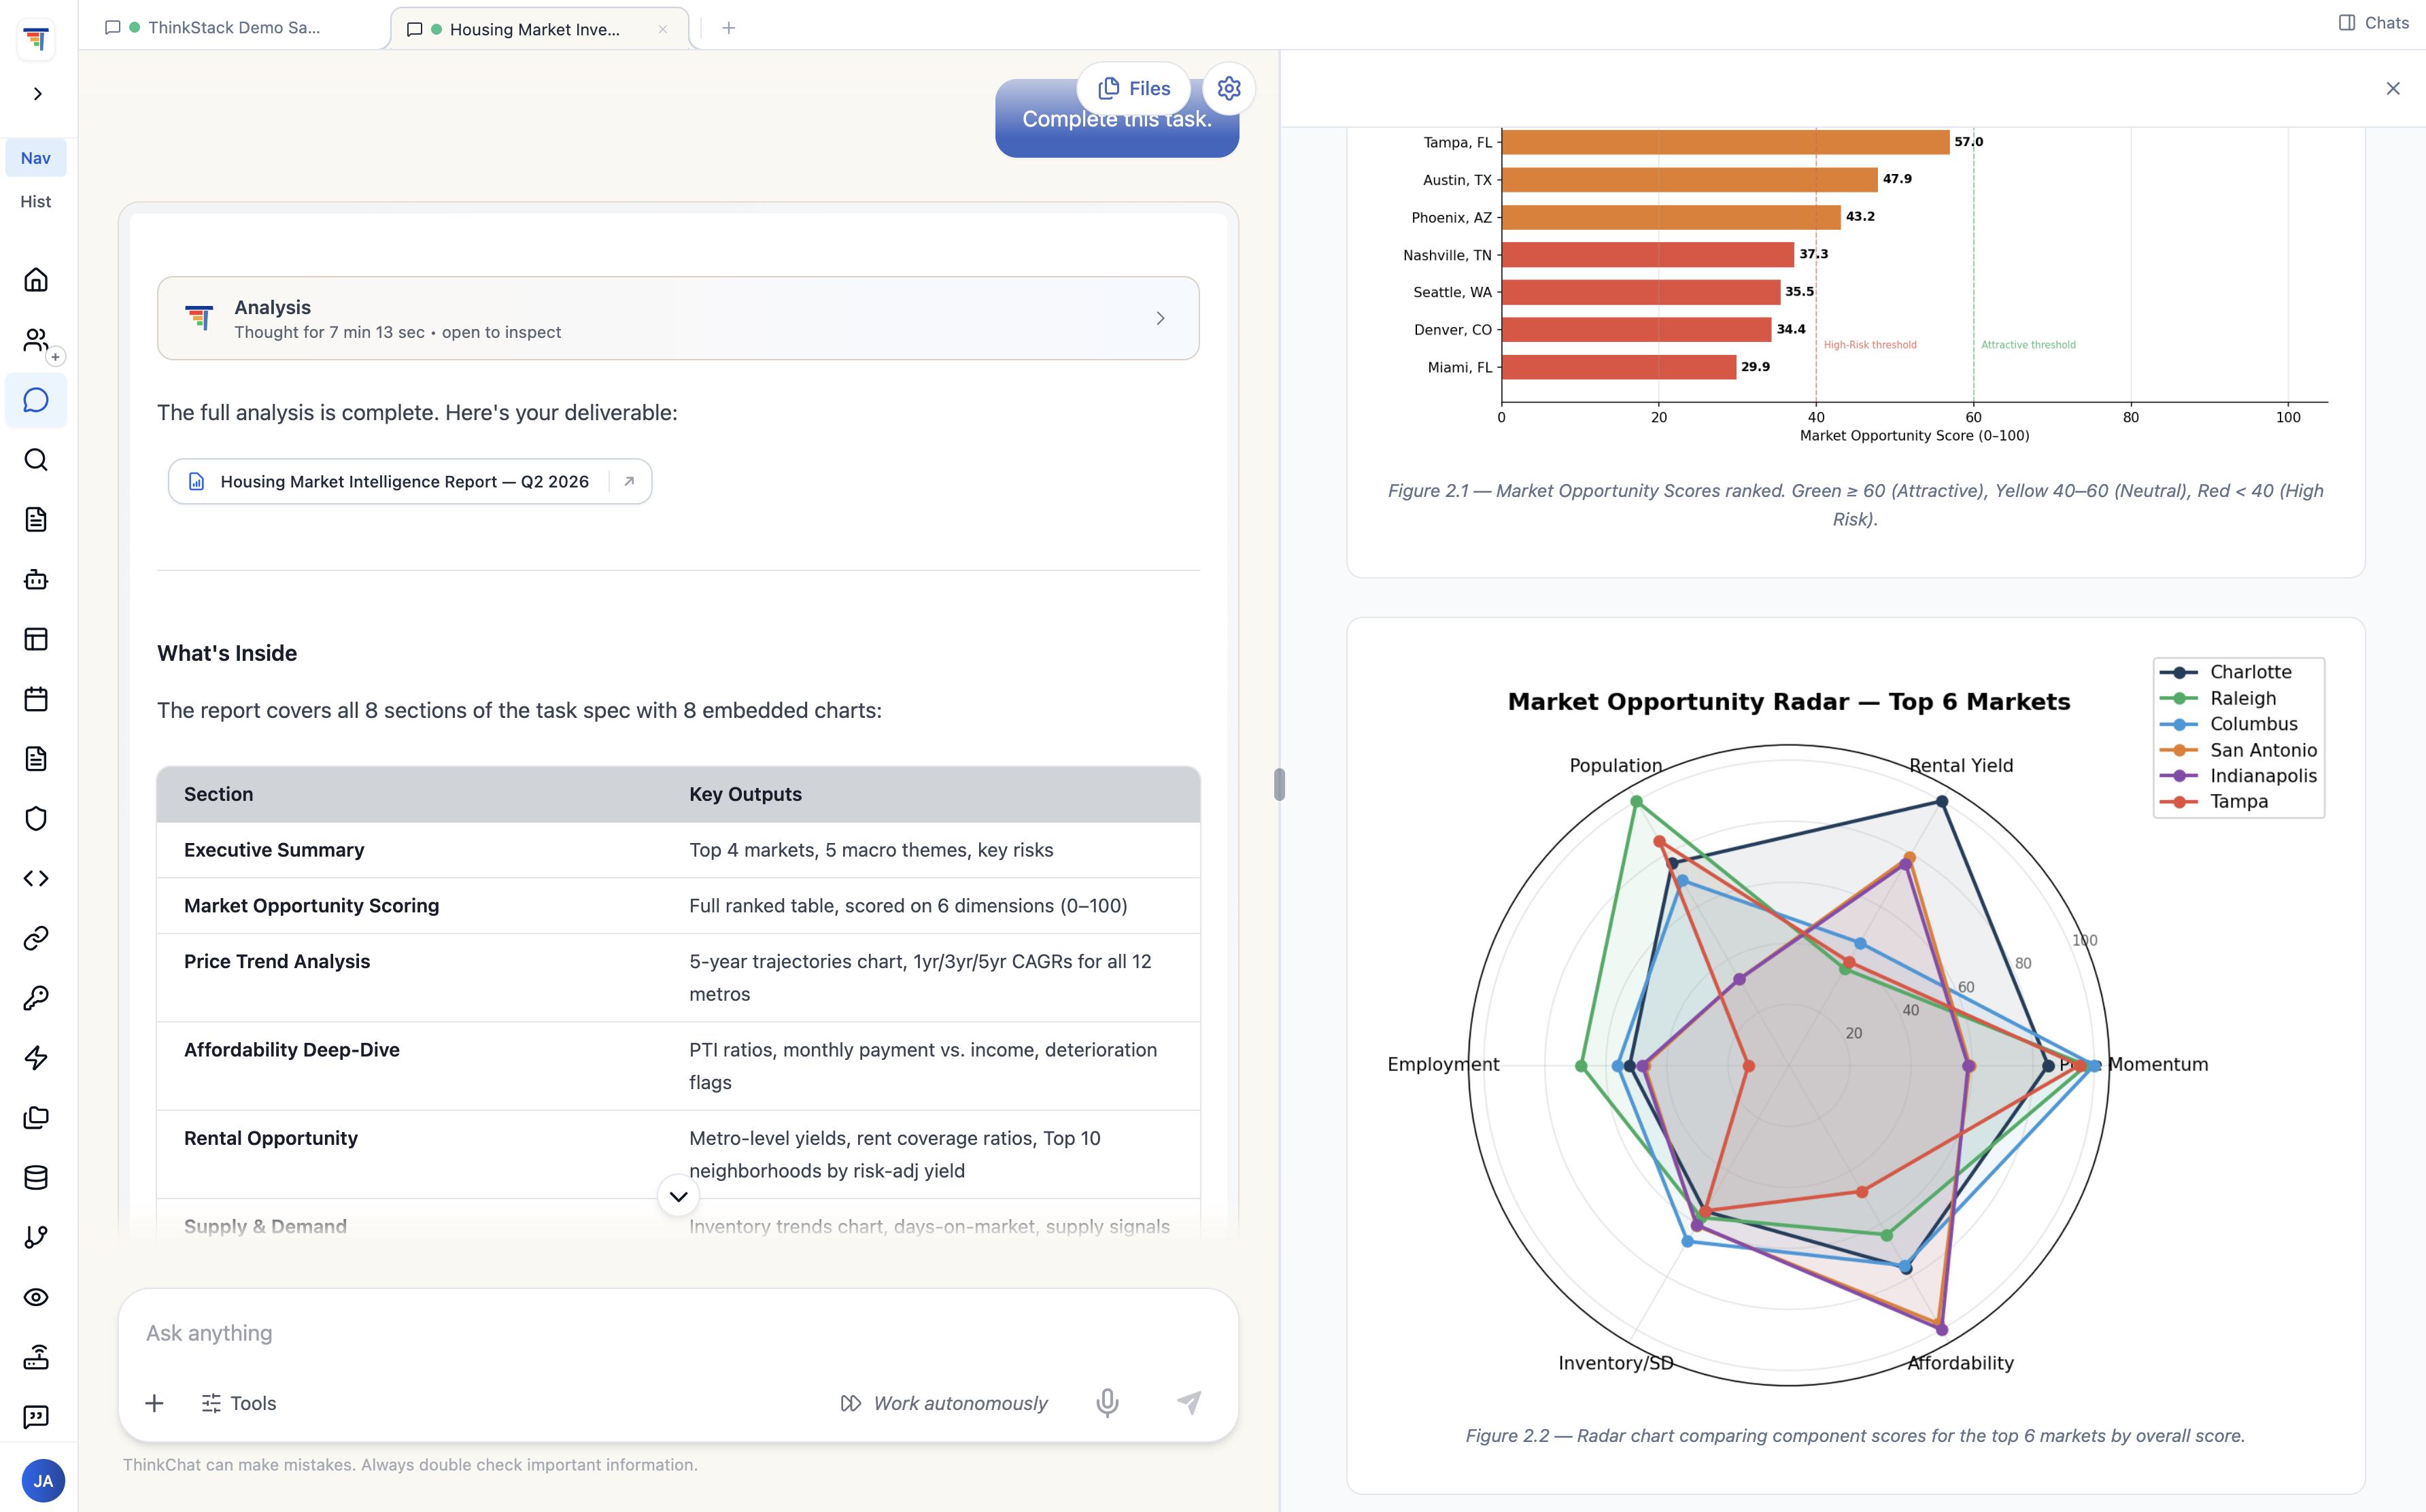
The finished report with ranked market-opportunity scores and a comparison radar chart

Asked in plain language — returned as a chart

Analyze the housing market data, calculate key statistics, and show the top 10 neighborhoods by median sale price.
housing_analysis.py Run
1import pandas as pd 2import numpy as np 3 4# Load data 5df = pd.read_csv('housing_market.csv') 6 7# Calculate key statistics 8median_price = df['median_sale_price'].median() 9avg_price = df['median_sale_price'].mean() 10 11# Top 10 neighborhoods by median sale price 12top10 = (df.groupby('neighborhood')['median_sale_price'] 13    .median().sort_values(ascending=False).head(10))

The code it wrote, and what that code returned

Creates and Runs the Code for You

Numbers are computed, not guessed. The agent writes SQL and Python, executes it against your data, and shows you exactly what it ran.

SQL and Python, executed. Real queries and real dataframes — every figure traceable to the code that produced it.

Checks its own work. Profiles the data, handles nulls and outliers, and re-runs when a result looks wrong.

Editable, not a black box. Change a filter or a join and re-run. It is your analysis, not an opaque answer.

Point It at the Data You Already Have.

No exports, no copying rows into a chat window. Connect the warehouse, database, or files where the numbers already live — and ask from there.

Warehouses & databases. Query live tables directly. Schema and row counts stay in view as you work.

Files and exports. Drop in CSVs, spreadsheets, or Parquet and analyse them alongside connected sources.

Your existing permissions. Analysts see what they are already entitled to see — nothing widens access.

S3
Snowflake
BQBigQuery
Postgres
Google Drive
ThinkStack workspace

Connect to the housing_market warehouse table and pull everything from the last 12 months.

Connecting to warehouse
Checking your permissions
Loading data (842K rows)
XLSX
DOCX
PDF
Analytics TeamCan access
Finance TeamCan access
LeadershipCan access

Connected sources — query them where they live
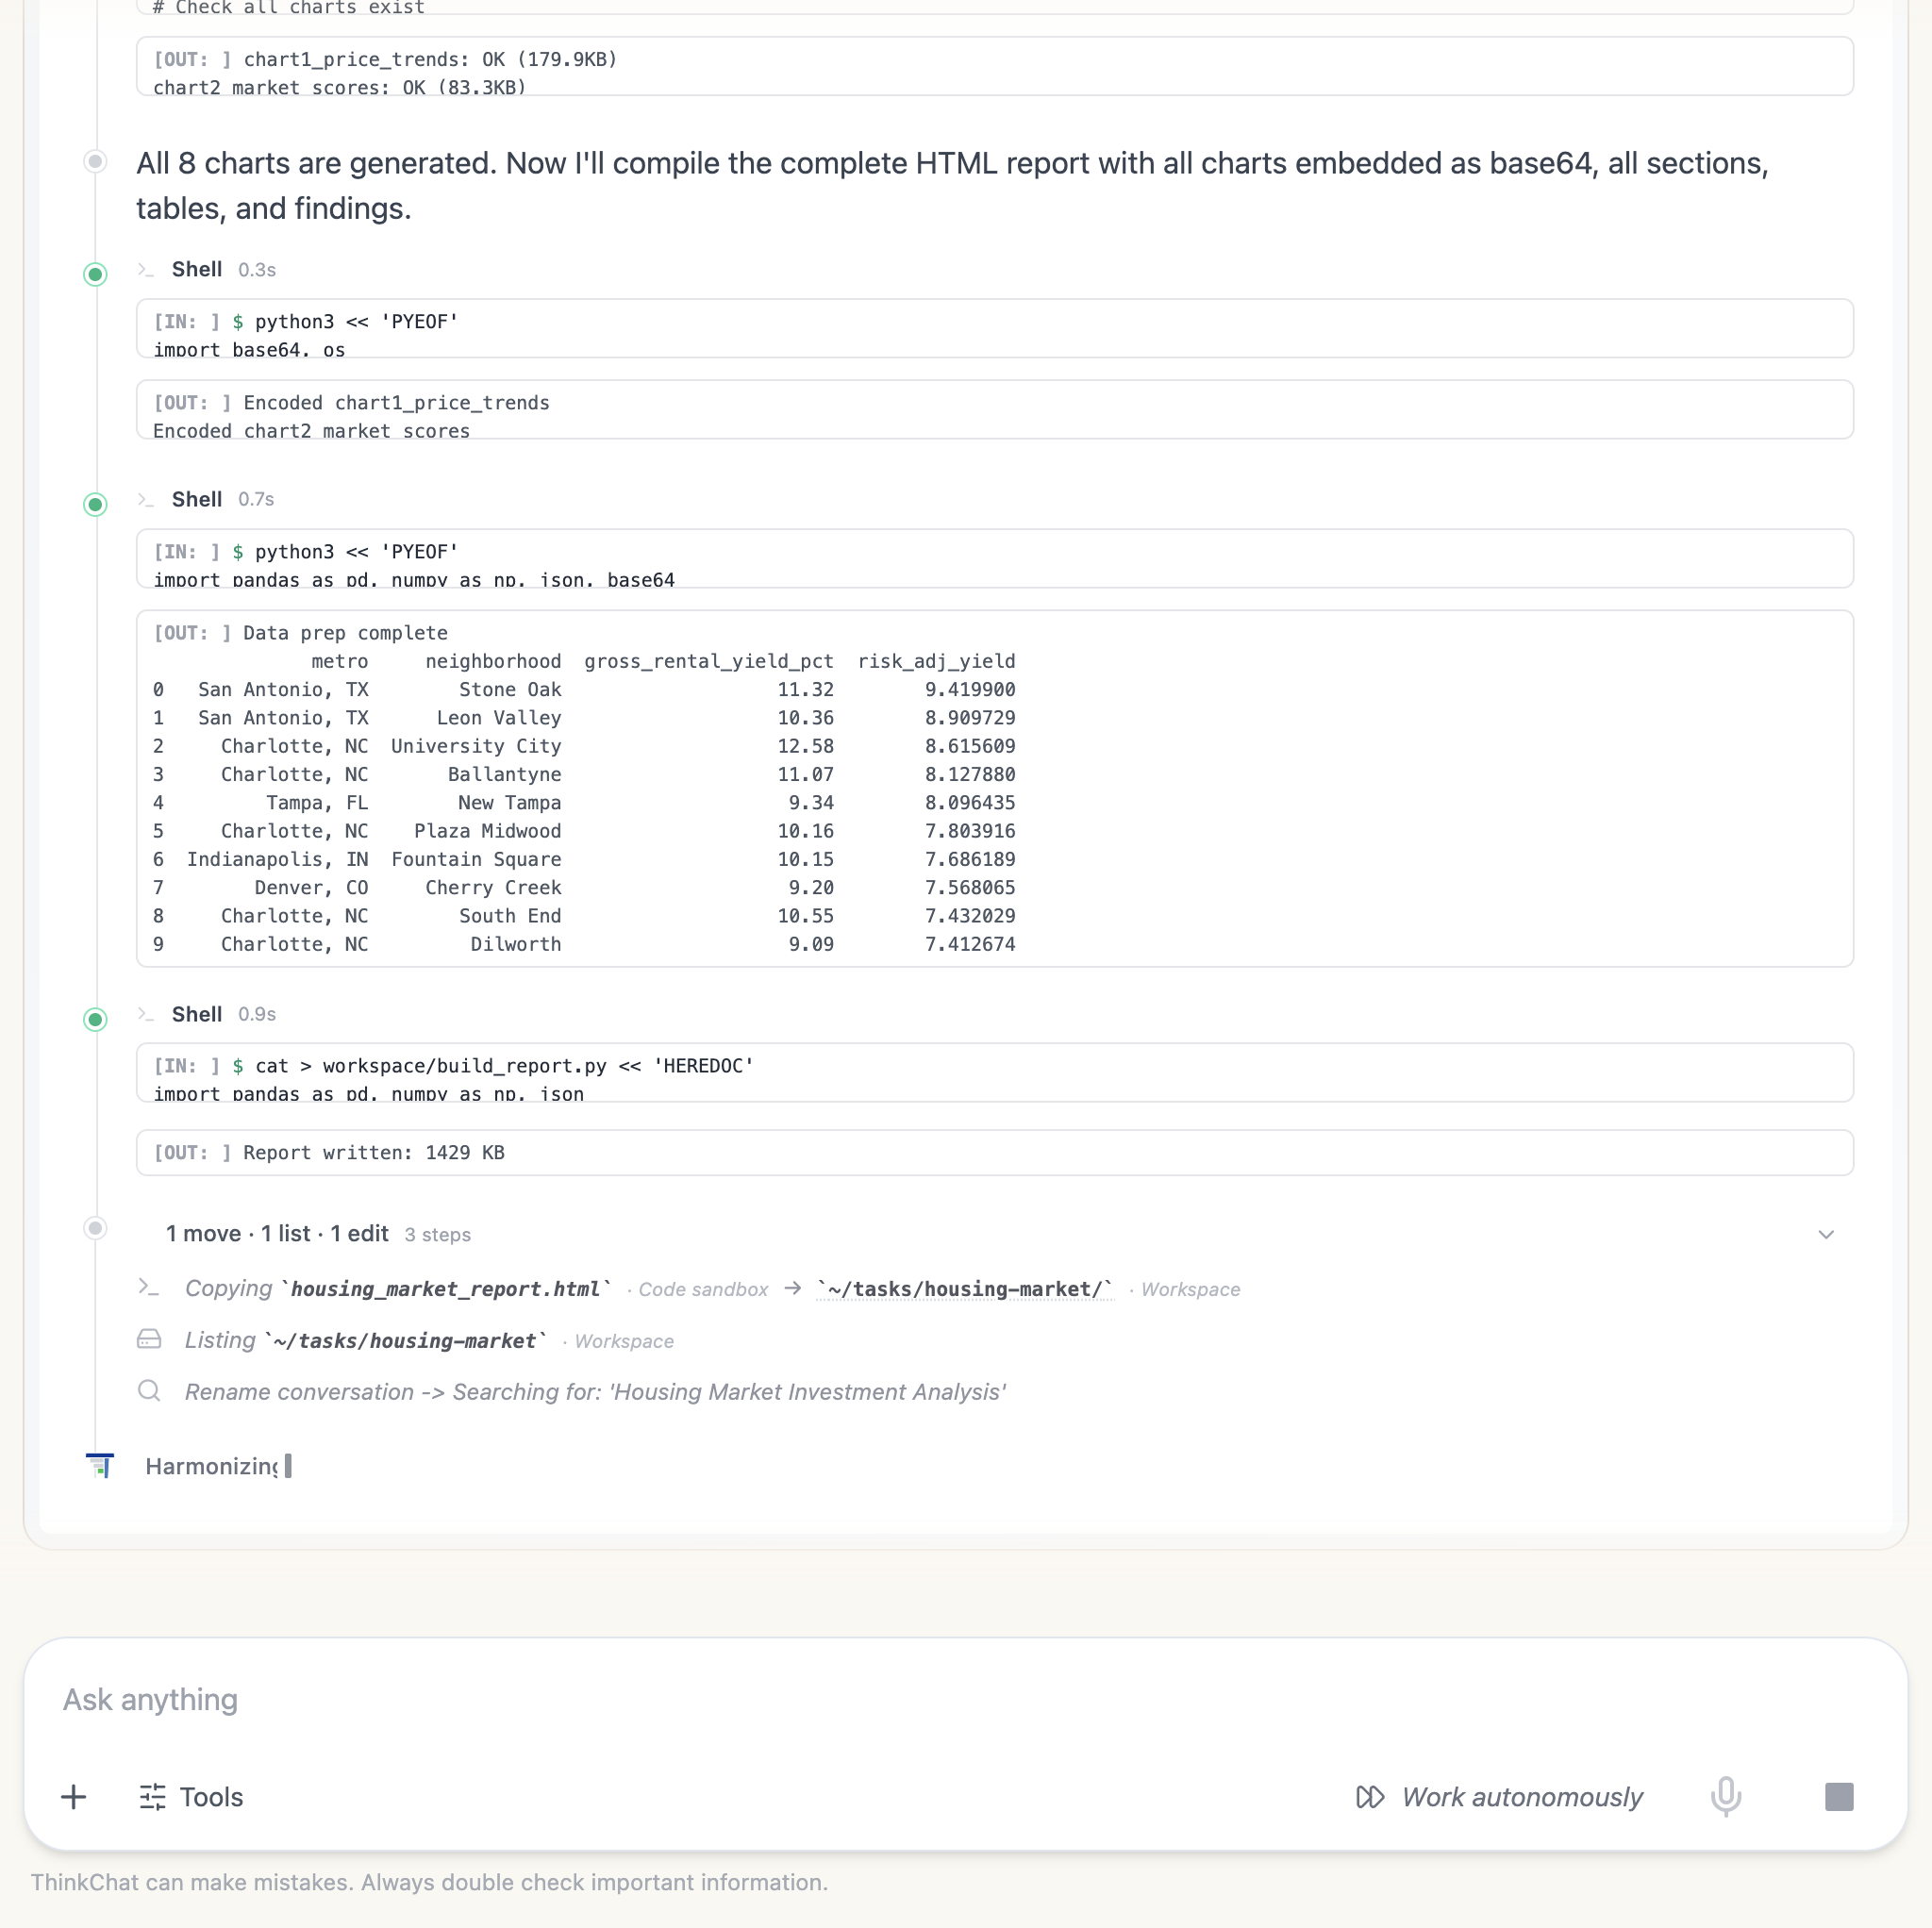
Execution trace — shell steps generating charts, prepping data, and writing the report

Every step of the run, in order

Trace Every Step

An analysis nobody can check is an analysis nobody should act on. Every run is traced end to end — the queries, the transforms, the rows, the timings.

Full execution trace. Every query, transform, and chart step recorded in the order it happened.

Every number has a source. Trace any figure in the output back to the table and the rows it came from.

Reproducible runs. Re-run the same analysis next month and get a comparable result, not a fresh guess.

Messy Data? No Problem!

Point ThinkStack at the warehouses, databases, and file stores your team already uses — Snowflake, BigQuery, Postgres, S3, or a folder of CSVs. Connect once and ThinkStack agent will be ready to go!

✓Query data where it lives
✓SQL and Python, executed
✓Charts, tables, and reports
✓Full execution trace

Frequently Asked Questions

Common questions about Data Analysis Playground.

Does it actually compute, or estimate?+
It computes. The agent writes SQL and Python, executes it against your data, and shows you exactly what it ran — real queries and real dataframes, with every figure traceable to the code that produced it. It also profiles the data, handles nulls and outliers, and re-runs when a result looks wrong.
Do we have to move data in?+
No. Connect the warehouse, database or file store where the numbers already live — Snowflake, BigQuery, Postgres, S3 or a folder of CSVs — and query live tables directly, with schema and row counts in view as you work. Files and exports can be analysed alongside connected sources.
Can someone check the analysis?+
Every run is traced end to end — the queries, the transforms, the rows and the timings, recorded in the order they happened. Any figure in the output traces back to the table and rows it came from, and re-running the same analysis later gives a comparable result rather than a fresh guess.
Can we edit what it did?+
Yes. Change a filter or a join and re-run — the analysis is yours rather than an opaque answer. Output is a rendered chart, the table behind it and a written read of what changed, which can be exported to a doc, posted to Slack, or scheduled to re-run and send itself.